![]()
PATH
MacOS X Server Release Notes Copyright \xa9 1998 by Apple Computer, Inc. All Rights Reserved.
Mac OS X Server Developer Release Notes:
Debugging
This file contains release notes for the Customer Release 1 of the gdb and jdb command-line debuggers, and of the Project Builder visual debugging facilities. The section in this document are:
- gdb
- A command-line debugger for C, Objective-C, and C++ programs
- jdb
- A command-line debugger for Java applets and 100% Pure JavaTM programs
- Project Builder
- Visual debugging for C, Objective-C, and C++ programs using gdb and Java debugging using the Java debugger.
GDB Versions
The version of gdb for Yellow Box for Windows is based on GDB version 4.16, released on April 22, 1996 by the Free Software Foundation (FSF). This is the same version of GDB that shipped with the Yellow Box for Windows Developer Release.
Two versions of gdb are shipped with the Rhapsody release. The first, /usr/bin/gdb-4.14, is based on GDB version 4.14, released on March 8, 1995 by the Free Software Foundation (FSF), and is the same version of GDB that shipped with Rhapsody DR1 and Rhapsody DR2.
The second, /usr/bin/gdb-4.17, is based on GDB version 4.17, released on April 24, 1998 by Cygnus Solutions (Cygnus). Although still a bit immature, this newer version of gdb offers better support areas such as signal handling, attaching to running processes, and dynamic library loading, as well as a number of bug fixes.
This version of GDB currently used by default is /usr/bin/gdb-4.17, installed as the default via a symbolic link from /usr/bin/gdb to /usr/bin/gdb-4.17. To change the default gdb to gdb-4.14, execute the following command as root:
ln -sf gdb-4.14 /usr/bin/gdbTo change back to using gdb-4.17 as the default, use the following command (also as root):
ln -sf gdb-4.17 /usr/bin/gdb
Additional Documentation
On Rhapsody Systems, a summary of command-line options for gdb is available via the manual page for gdb (1).
For more information on gdb-4.14, see the documentation in /System/Documentation/Developer/YellowBox/Reference/DevTools/Debugger . For release notes on gdb-4.14, see the gdb-4.14 release note.
For more information on gdb-4.17, see the documentation in /System/Documentation/Developer/Commands/gdb/gdb. Release notes for gdb-4.17 are in this document.
A single-page gdb-4.17 reference card, suitable for printing, is available in both PostScript and in PDF format. For those interested in the internal workings of gdb-4.17, complete source code is available either via the Source CD, or via FTP.
For the most up-to-date information on either version GDB, see the Rhapsody Developer Release website on the Apple Developer web site. Updates to gdb-4.14 and gdb-4.17 will be posted here as they become available.
Significant Changes from gdb-4.14 to gdb-4.17
- No longer requires breakpoint at
start()for shared-library loading. - Improved C++ support.
- Improved support for detecting Objective-C function calls (improves single-stepping into Objective-C functions).
- Improved stack-parsing code on PowerPC (now backtraces properly over signals and frameless functions).
- New command
remove-symbol-fileallows removal of obsolete symbol table entries. - New-style thread support (
info threads,thread apply num command, etc.). - Supports
info symbolcommand. - Supports
info sharedlibrariescommand. - Properly prints names/addresses for dyld symbol stubs.
- Properly retrieves float/double/long/char arguments/return values on PowerPC.
- Support for mmap() or read() file reading.
- Supports
DYLD_{FRAMEWORK,LIBRARY}_PATHandDYLD_INSERT_LIBRARIESenvironment variables (see dyld (1) for details). - DYLD symbols available before program has launched (allows easier setting of breakpoints).
Known Problems in gdb-4.17
Breakpoints hit by multiple threads confuse GDB
If the same breakpoint is hit simultaneously (or near-simultaneously) by multiple threads within a process being debugged, GDB is unable to handle the race condition that develops among the multiple exceptions to be handled.
This will typically lead to GDB stopping at unexpected locations in the inferior with a SIGTRAP (rather than a breakpoint) --- typically a thread other than the current thread will be at the breakpoint address, and GDB will be showing the leftover exception from the other thread hitting the breakpoint.
Occasionally, multiple threads hiting the same breakpoint can lead to overall system instability, including hanging GDB, creating un-killable processes, and sending SIGTRAP signals to un-related processes.
Unable to start dyld properly when attaching to processes
When attaching to already-running processes, gdb-4.17 is unable to properly start the DYLD debugging thread in the attached process. Although GDB will try to read the shared library information from the program's symbol file, the absence of the DYLD debugging thread will cause gdb-4.17 to be unaware of any non-prebound libraries and/or bundles the program may have loaded, and cause gdb-4.17 to guess the wrong value for the addresses of any prebound libraries and/or frameworks.
Unable to detach properly from attached programs
When gdb-4.17 tries to detach from attached processes, it mistakenly leaves the process in a "STOPPED" state. If the process has a controlling terminal, it can be continued by suspending and resuming the process from the shell; otherwise it may be able to be continued using
kill -CONT <pid>.Requires '-' or '+' required when referring to selector names
gdb-4.17 will not implicitly add an initial '+' or '-' to to Objective-C method names when reading expressions from the command-line. Instead, you will need to fully specify the desired method name (e.g.
-[NSException raise], not just[NSException raise]).May get incorrect method addresses when using 'break selector' syntax
Occasional reports have arisen that gdb-4.17 can use the incorrect address for an Objective-C method when using the
break selectorsyntax for setting breakpoints. If this problem arises, it can be worked around by using the full name of the method (e.g.-[NSException raise]) to set the breakpoint. This is believed to be limited to scatter-loaded executables. Project Builder does not scatter load programs it builds by default.Unable to complete on selector names
gdb-4.17 is unable to provide TAB-completion on the short forms of Objective-C selector names. You will either need to specify the method name fully (e.g.
-[NSException raise]), or type the full selector name without using completion.Note that the completion mechanism used by gdb-4.17 is separate from that used by the ProjectBuilder interface to GDB (which should work properly).
Moderate performace loss vs. gdb-4.14
Current versions of gdb-4.17 are between 20--30% slower than gdb-4.14 on equivalent debugging tasks. Although gdb-4.17 is eventually expected to be as fast as or faster than gdb-4.14, performance tuning has not yet been completed on gdb-4.17, leading to somewhat reduced performance.
Possible problems in
future-breakWhen breakpoints are set in shared library or bundle code using
breakorfuture-break, gdb-4.17 is supposed to properly detect when a breakpoint cannot be inserted due to an unmapped shared library, mark the breakpoint as temporarily disabled (shlib-disabled), and re-try inserting the breakpoint after any new shared libraries are loaded. Occasionally, gdb-4.17 will mistakenly set the state of a breakpoint that cannot be inserted todisabledinstead ofshlib-disabled, causing it not to be properly re-inserted when the corresponding shared library is loaded. You can get a list of the status of all breakpoints using the commandinfo breakpoints. To fix this problem for any affected breakpoints, you can manually re-enable the breakpoints using theenablecommand.
Thedata-breakcommand not supporteddata-breakcommand is not supported in gdb-4.17. Thewatchcommand provides a superset of the functionality ofdata-break, but has not yet been extended to make use of hardware traps to determine when data has been read/written, and so is substantially slower thandata-break.
Notes Specific to jdb
New Features
The jdb command-line debugger from JavaSoft is included in the Developer Release 2 of both Rhapsody and Yellow Box for Windows. You can find the documentation for jdb Rhapsody at:
http://java.sun.com/products/jdk/1.1/docs/tooldocs/solaris/jdb.html
and for Windows at:
http://java.sun.com/products/jdk/1.1/docs/tooldocs/win32/jdb.html
Known Problems
jdb Does not Work With "Pure Yellow Box Java"
Yellow Box Java applications, that is, those that subclass from
NSPureApplication and are started with the java command, do not work with jdb. For example, this command fails:
jdb com.apple.yellow.application.NSPureApplication -YBJavaApplicationPath /<wherever>/TextEdit.app"
Notes Specific to Project Builder Debugging
Project Builder provides integrated, visual debugging of programs
through the Launcher panel (![]() ). This panel can be used to run or debug executables built by
your project.
). This panel can be used to run or debug executables built by
your project.
Notes on Using Java
There is a new tutorial for developing Yellow Box Java Applications (<Link TO Terrys Tutorial>); this document describes how to use InterfaceBuilder and ProjectBuilder to create and manage Java applications. Here are view hints regarding debugging Java
- Set the Build Target to "debug" (See the Build Options Panel). Building "debug" ensures that Java files are compiled with the "-g" option, which provides full symbol information.
- On Windows, .DLLs loaded by the Java VM must end their names in "_g". That is, if Java code asks to load a library named "Foo", then, when the JVM is in debug-mode, it will attempt to load a library named "Foo_g.dll". The pb_makefiles build this
- On Windows, must name .DLLs _g.... iinstall_java_debug (happens automagically for JavaPackages)
New Features for CR1
- ProjectBuilder now has the capability to use all open projects
as providing source for debugging. For example, open a project
building an application and start debugging that application;
then open another project which builds a framework used by that
applicaiton You can then step into source code in the framework
and set breakpoints in it. It is also possible to debug two targets
(from different projects) at the same time; this is useful for
debugging client/server programs.
The capability to used all open probjects for debugging is controlled by the "Search for source in all open projects" check-box on the Debugging Preference panel. By default, it is ON/OFF???
- The Launcher Options panel interface has been updated:
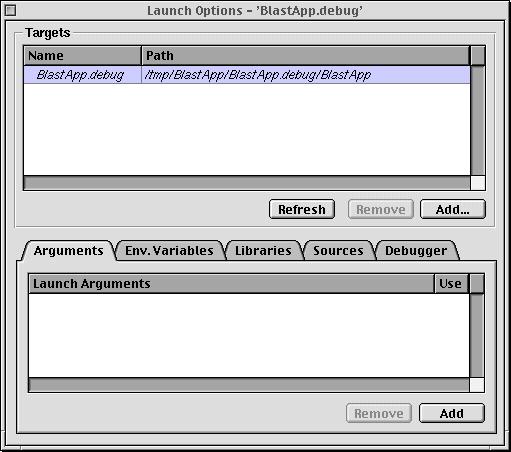
The Targets list shows all the target executables in the project plus the ones explictly added. The tab view below shows the settings that apply to the currently selected target. The Arguments tab shows the command line arguments givent to the target; only one line of argments can be used at a time. The Env(ironment) Variables tab managements the environment for the target. The Libraries tab manages the paths used to find dynamically loaded libraries. The Sources tab allows the specification of addtional directories to look for source files when debugging. The Debugger tabs controls which debuggers (Gdb and/or JavaDebugger) are used.
- store options in PBUserInfo directory. Options are operating system-dependent.
Known Problems
Only Debug Yellow Box Java Applications
There is no debugging support for Java applets or 100% Pure Java applications.
Setting Breakpoints Before Running
You cannot set breakpoints in Java code before the debugger is running. As the Java VM starts up, there is a race condition between the starting of the debugger and the starting of the application. Therefore, some of your code will execute before the debugger becomes active and you are not able to set a breakpoint in this code.
No mixed stack backtrace
The stack back trace from the Java debugger includes only Java frames. Calls to native methods are not shown.
New Features for DR2
The following new features have been added to Project Builder for debugging since the Developer Release.
- Debugging Java applications: Project Builder now supports debugging
Java applications which use the Yellow Box APIs. You can creat
and manipulate breakpoints graphically, examine the Java stack
in the stack inspector panel, and printed variables selected in
the source code.
Just for your information: The Java Debugger is used if your application has the NSJavaAware key set in its Resources/Info.plist dictionary. The pb_makefiles set this key automatically if your project has any Java files in it.
- Java Debugger commands: The Java Debugger available through Project
Builder also provides a command-line interface which is similar
to that of jdb. Please see the Java Debugger Command Reference for a full description of the commands. The prompt for the Java
debugger is "JavaBug>> ". Some debugging features, like listing
the active threads and thread groups, are only available through
the command-line interface.
Since the Java debugger is implemented as a set of threads in the Java VM, it is always active when the Java VM is running. It is possible to interact with the Java debugger even while the target is running. This is in contrast to gdb, which only processes commands when the target is stopped.
- Using both gdb and the Java Debugger from Project Builder: There is a new Project
Builder Preference panel for debugging options. One checkbox controls
if the gdb debugger is used when debugging Yellow Java applications in addition
to the Java Debugger. Checking this box allows your C, Objective-C,
or C++ code to be debugged with gdb and your Java code with the Java debugger.
The process (application) being debugged is known as the debug target . The Java debugging code runs within the target Java VM. When gdb has stopped the target, it has also stopped the Java VM and hence the Java code can't run. So when the target stops in a Java breakpoint, Java stack frames are shown (there is no 'mixed' stack trace yet) and Java debugging information is available. When a gdb breakpoint is hit, C, Objective-C, and C++ information is available but no Java information is available.
Finally, here's how to get the gdb prompt when the target is running. In the Launcher terminal window, press ^C (Control-C) once or press the suppend button (
 ). This will stop the target and make the Java debugger active.
To get to the gdb prompt, press Control-C again and then press the continue button
(
). This will stop the target and make the Java debugger active.
To get to the gdb prompt, press Control-C again and then press the continue button
( ); you will now have the gdb prompt and the target is completely stopped, including the Java
VM.
); you will now have the gdb prompt and the target is completely stopped, including the Java
VM. - Better "Build & Debug" support: Another new debugging preference
is called "Stop running programs when building". This preference
is useful for developers on Windows. When the "Build & Debug" menu item is selected, Project Builder first stops any running
or debugged executable. If this preference is checked, Project
Builder automatically stops the executable without prompting.
If it is not checked, Project Builder displays a dialog asking
if you want to stop the executable.
- Improved breakpoint manipulation: When using either gdb or the Java debugger, it is now possible to create a breakpoint
while the target is running. Just double-click in the margin to
the left of the code view next to the line of source code where
you want the breakpoint. A pending breakpoint icon (
 ) then appears and will change to an enabled breakpoint icon (
 ) once the debugger has actually created the breakpoint. Pending
breakpoints cannot be moved or deleted; you must wait until it
becomes enabled. When a breakpoint is selected (
) once the debugger has actually created the breakpoint. Pending
breakpoints cannot be moved or deleted; you must wait until it
becomes enabled. When a breakpoint is selected ( ), it can be moved up and down in the file or; if you drag to
the left or right, it is deleted.
), it can be moved up and down in the file or; if you drag to
the left or right, it is deleted.